

As a native of Michigan, I found it interesting to note the misinformation on Great Lakes ice-cover published by the government in the latest National Climate Assessment.
It further supports my view that billions of dollars are wasted by government climate change studies, touched on in my post, Climate change to cause civil and political unrest, July 6, 2014.
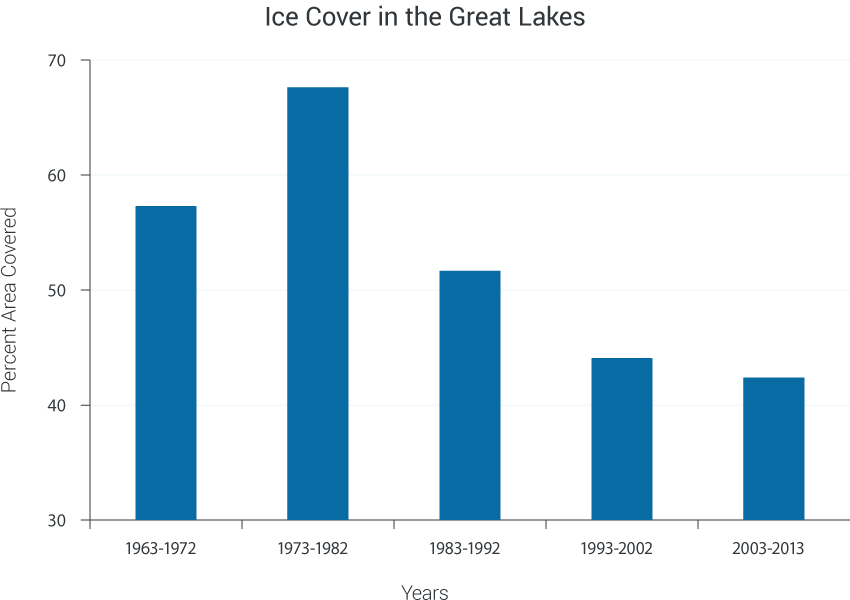
This chart from the National Climate Assessment incorrectly depicts ice-cover on the Great Lakes decreasing.
“Rising temperatures across the United States have reduced lake ice, sea ice, glaciers and seasonal snow covers over the last few decades,” the Assessment states and adds, “In the Great Lakes, for example, total winter ice coverage has decreased by 63 per cent since the early 1970’s.” Tell that to iron ore shippers who saw March 2014 shipments from Lake Superior via Lake Michigan to Gary, IN down 43 percent over March 2013.
In 1979 the Great Lakes were 95 per cent ice-covered. In 1994, fifteen years later, they were 94 per cent ice-covered, and this past winter they were again in the 90 percentile, with Lake Michigan setting a new record of 93.3 percent ice cover on March 8, 2014. You might say it’s cyclical.
Oddly, the Assessment pointed to benefits of warming, including longer growing seasons for agriculture and longer ice-free periods for shipping on the Great Lakes.
While climate change supporters worry over a 1.3 degree Fahrenheit rise in U.S. temperature in the past 100 years, the record shows ice-cover on the Great Lakes in the 90 percentile three times in the past 35 years.
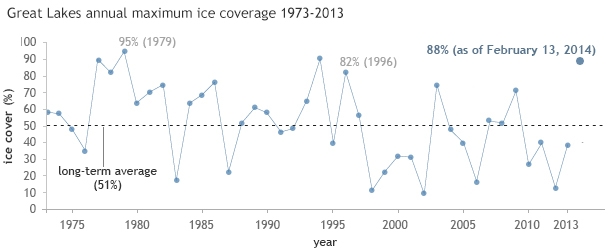
This chart published by the National Oceanic and Atmospheric Administration (NOAA) provides a clearer picture of the cyclical nature of Great Lakes ice-cover.


